Introduction
In this post, we discuss how a test score is an imperfect estimate of a student’s ability. Then we look at how test results include information on standard errors and provide confidence bands. Components of test score variance are then described. And the relationship between measurement error and reliability is explained.
Estimates and Related Error
Measurement error is not a new concept for anyone. Whenever results of pre-election presidential polls are presented, there’s always mention of a margin of error – typically plus or minus three or four percent. When poll figures for two candidates are close, you’ll often hear they are “within the margin of error,” meaning either candidate could be ahead in actuality. A major factor contributing to the accuracy of a poll is the quality of the sample of people responding to the poll question – the size of the sample and how representative the sample is of the target population of interest. How the poll question is presented, even worded, can make a difference. Who do you like most, who would be a better leader, who will you vote for, who would be best at such and such? Other aspects of the polling could have an effect on the sampling and the results – where it’s done (at the gas pumps, the recycling sites, or supermarkets, for example), the presentation or appearance of the pollsters, the time of day, and the source of phone numbers for telephonic polls.
Test Scores as Estimates with Error
Test scores are estimates, too. With respect to a student’s ability relative to a school discipline or a particular curricular standard, there is an underlying “truth.” So a test score is an estimate of a true score, which we never really know. Our estimates include some errors, which are the differences between the obtained test scores for students and the hypothetical true scores. Fortunately, we have ways of minimizing and estimating the amount of error in test scores.
Factors Contributing to Measurement Error
Think back to the political polls. The factors affecting the accuracy of results or contributing to errors are similar for educational tests. The quality of the item sample is important. How representative are the test items of the content and skills in the subject domain or curricular standard being tested? Are there enough of them? Relevant characteristics of the test include such things as the item type (multiple-choice or constructed-response requiring human scoring), four-option multiple-choice or five-option, four-point or six-point scoring rubrics for constructed-response questions, bias in some items. Test administration conditions can contribute to measurement error: time of day, timed or untimed sessions, interruptions, timing relative to significant events in the school. And of course, individual students might have issues leading to error — for example, fatigue, not taking a test seriously, not feeling well, not understanding directions, and unfortunately even copying answers of another student.
Standard Error of Measurement and Confidence Bands for Test Scores

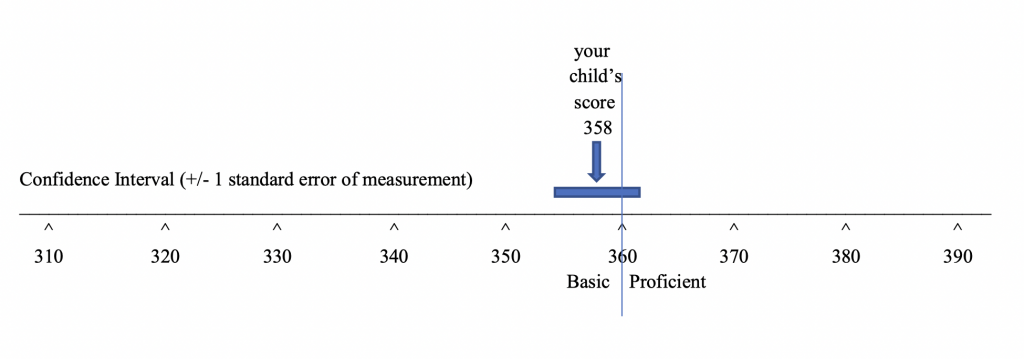
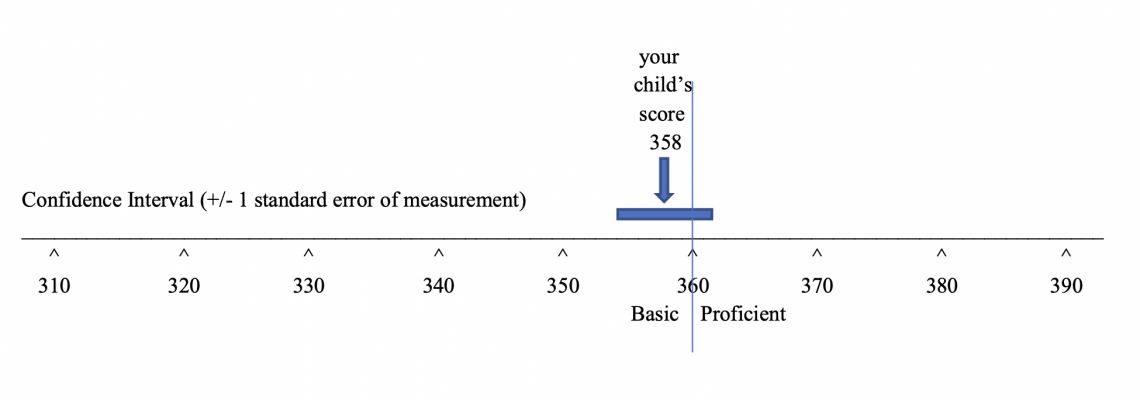
A standard error of measurement is an estimate of the amount of error in a test’s scores. In Lesson 5, you saw that a lot of information is often presented in relation to a test score scale. What we didn’t show is another bit of information often depicted on the same scale – a confidence band. A confidence band is a score interval that runs from one standard error below a particular score to one standard error above the score. The general advice to parents and teachers is to not make a big deal of differences between two scores that are within a standard error of one another. Often a student’s test score is compared to a class average, a state average, or a cut-point on the score scale separating two achievement levels. In this display, the student’s score is below, but within a standard error from the cut score separating the basic and proficient levels of achievement. If tested again using an equivalent test, the student could well score a few points above the cut score of 360. By the way, the confidence band in the display could just as easily have been centered around the cut score. It would still show that the student scored within a standard error of measurement from the cut score.
Components of a Test Score
x = xt + eNow for this and the next few sections, we’ll use a little measurement theory and low-level algebra. A student’s obtained test score x is an estimate of a true score and, in theory, is made up of a true score xt plus error e. (The error can be positive or negative.) We don’t know an individual’s true score or the error associated with it. We just know our estimate of the true score.
Components of Test Score Variance
x = xt + e
(sx)2 = (st)2 + (se)2
We know that a set of test scores can be represented in a distribution of scores – typically close to a normal distribution. (Remember Lesson 6.) The variance of a score distribution is a measure of the variability of the scores – how spread out they are. It stands to reason, then, that the score variance (sx)2 is made up true variance (st)2, the actual variance due to student differences in ability relative to what is tested, and variance due to error (se)2. That is, there is a distribution of students’ true scores and a distribution of score errors.
Measurement Error and Reliability
(sx)2 = (st)2 + (se)2
1 = (st)2/(sx)2 + (se)2/(sx)2
Now taking that last equation and dividing both sides by (sx)2 we get this equation. It makes sense. Working in proportions, it says that the proportion of total or obtained variance due to true variance plus the proportion of total variance due to everything else (error variance) is equal to one.
(sx)2 = (st)2 + (se)2
1 = (st)2/(sx)2 + (se)2/(sx)2
1 = rxx + (se)2/(sx)2
se =  (sx)√(1 - rxx)
So here’s the neat part: The ratio of true variance to total variance is the technical definition of reliability. So rxx is an estimate of reliability. Solving the third equation above for se , we get a formula for the standard deviation of the error distribution, the standard error of measurement. We can compute this because we know the standard deviation of test scores sx and we have estimates of reliability. You’ve probably heard of test-retest, parallel forms, split-half reliabilities – these all involve correlation coefficients, and correlation coefficients squared are proportions of variance – proportions of variance in one variable accounted for by another variable. Thus, reliability rxx is equivalent to a correlation coefficient squared. Enough algebra. The point is that the standard error of measurement for a test, sometimes separately reported and sometimes reflected in confidence bands, is a function of the variability of test scores and the reliability of the test. While this presentation reflects the most common approach to dealing with measurement error, some testing programs use more sophisticated approaches based on the idea that measurement error associated with student test scores varies depending on where on the score scale the scores fall.
Summary of Key Points
- In summary, test scores are estimates of students’ capabilities; and as such, they are imperfect, containing some error.
- Measurement error is due to countless factors related to the sampling of items, the quality of the measures, test administration conditions and practices, and characteristics of the students other than abilities relative to what the test is measuring.
- The standard error of measurement is an estimate of the amount of error in a set of test scores and should be taken into account when comparing individual student test scores to each other, to group averages, and to score thresholds for achievement levels. Small differences should not be over-interpreted.
- The standard error of measurement is a function of test score variability and test reliability.
